The second quarter of fiscal year 2025 (1 January – 31 March 2025) saw extraordinary demand for Employment Authorization Documents (EADs), with more than 1.5 million new filings and nearly one million approvals issued. Initial applications dominated the caseload, but renewals still represented over two-fifths of all receipts. The analysis below unpacks the quarter in detail, highlights the busiest eligibility categories, and explains the interactive dashboard built to let readers explore every metric.
Aggregate Workload at a Glance
Total Volume and Outcomes
During the quarter the service received 1,535,329 new EAD applications. Processing offices completed 999,831 approvals and 83,102 denials, while 2,097,880 cases remained pending at quarter’s end. Table 1 summarizes the topline indicators.
| Metric | Count | Share of Receipts |
|---|---|---|
| Total Receipts | 1,535,329 | 100% |
| Approvals | 999,831 | 65.1% |
| Denials | 83,102 | 5.4% |
| Still Pending | 2,097,880 | — |
| Overall Approval Rate | — | 65.1% |
| Overall Denial Rate | — | 5.4% |
Application-Type Mix
Receipts broke down as follows:
- Initial: 855,690 (55.7%)
- Renewal: 662,790 (43.2%)
- Replacement: 16,849 (1.1%)
- “Not Requested” filings were negligible during the period.
Initial submissions enjoyed the highest success rate (76.0% approvals), whereas renewals were approved just over half the time (51.3%). Replacements fell in between at 56.0%.
Category-Level Insights
Where the Volume Was Concentrated
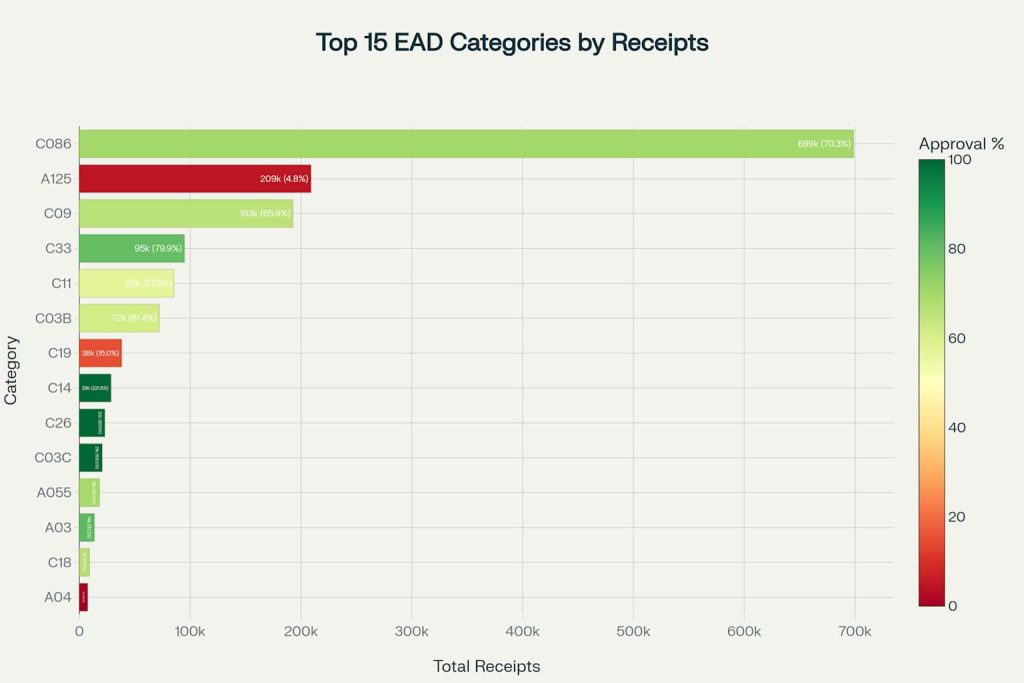
Only a handful of eligibility codes generated the lion’s share of activity. Fifteen categories each logged more than 4,000 receipts, together accounting for 83% of all filings.

Top 15 EAD Categories by Volume – Q2 FY2025 Application Data
Key observations:
- (c)(8) Asylum Applicant – Pending dwarfed every other group with 698 k receipts—nearly 46% of the quarter’s total.
- (a)(12)/(c)(19) Temporary Protected Status entries surged, reflecting both new TPS designations and re-registrations.
- (c)(9) Adjustment of Status (Form I-485 pending) remained a perennial high-volume pathway with 193 k receipts.
- (c)(33) DACA demand persisted (95 k receipts) despite the program’s long-term uncertainty.
- A small number of categories displayed approval counts that exceeded new receipts (e.g., (c)(14) Deferred Action). Those statistical quirks arise when large backlogs are cleared, causing approvals recorded this quarter to relate to receipts from prior periods.
Deep Dive: Highest-Volume Codes
- (c)(8) Asylum Applicant – Pending
- 70.3% approval rate—consistent with ongoing efforts to provide employment authorization to those awaiting asylum decisions.
- 445 k denials and 141 k new pendings indicate that despite high productivity the queue continues to swell.
- (a)(12) / (c)(19) Temporary Protected Status
- Over 247 k combined receipts across initial filings and prima facie TPS eligibility.
- Approval rates vary widely by sub-category, reflecting mandatory versus discretionary statutory language.
- (c)(9) Adjustment of Status
- Two-thirds of applicants secured approvals, sustaining EAD access while green-card cases pend.
- (c)(33) Deferred Action for Childhood Arrivals
- Remarkably high 80% approval rate and minimal denials reflect program stability during the reporting window.
Category Family Comparison
Grouping codes by prefix shows a stark divide:
| Category Family | Receipts | Approvals | Approval Rate | Pending Cases |
|---|---|---|---|---|
| A-Categories (humanitarian & family) | 252,055 | 39,468 | 15.7% | 452,908 |
| C-Categories (non-immigrant & adjustment) | 1,186,315 | 869,125 | 73.2% | 1,595,568 |
| Total / Misc. | 1 | 1 | 100% | 195 |
Humanitarian “A” codes often require extensive vetting or rely on downstream agency decisions, explaining their modest approval ratio and high pending stock. In contrast, “C” codes—especially those tied to predictable student or employment programs—move faster.
Application-Type Performance
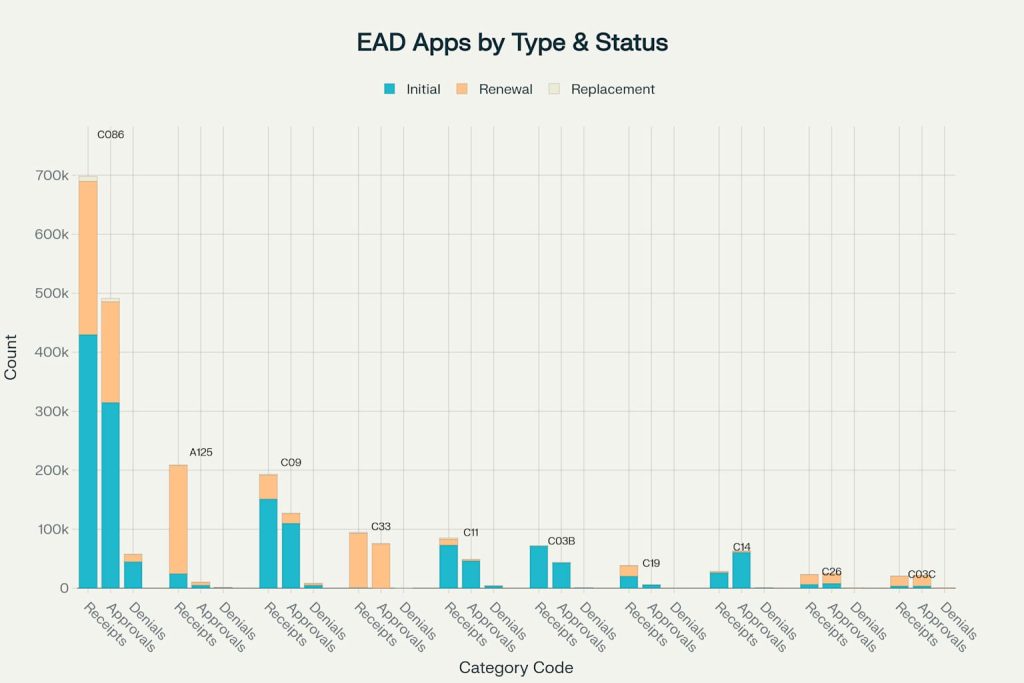
The stacked bar below contrasts receipts, approvals, and denials for the ten busiest categories, split by Initial, Renewal, and Replacement submissions.

Application Processing by Type – Top 10 EAD Categories
Noteworthy patterns:
- Renewals dominate categories such as TPS and DACA, where beneficiaries must regularly reapply to keep authorization current.
- Initial filings prevail in asylum-based categories because first-time applicants continue to outpace renewals even years into the backlog.
- Replacement requests are uniformly tiny, though counts spike in categories serving larger underlying populations (e.g., (c)(9) and (c)(8)).
Backlog and Timeliness
Pending inventory soared to roughly 2.1 million cases—exceeding total quarterly receipts. The backlog is heavily skewed toward initial asylum-related filings and humanitarian family unity cases. If approvals continue at the current clip, the queue would require more than two full quarters to clear even if no new applications arrived—an unlikely scenario.
Anomalies and Data Irregularities
A handful of categories showed approval or denial totals that mathematically outstrip receipts for the quarter. This occurs when historical cases—sometimes years old—receive final action in bulk after system updates or court-ordered holds are lifted (as happened with certain public-interest parolees). While these outliers inflate apparent approval rates, they do not distort the overall workload picture because the affected categories represent a small share of receipts.
Interactive Dashboard Design
To transform raw numbers into an intuitive exploration space, a single-page interactive dashboard accompanies this report. Core design elements include:
- Global Overview Cards – Animated tiles display total receipts, approvals, denials, pending cases, and rates for the currently selected category.
- Category Selector – A searchable dropdown lists every code, from A025 to C40 and UNKNOWN. Selecting a code instantly refreshes all visuals.
- Category-Type Filters – Pill buttons toggle between All, A-Category, and C-Category families, highlighting systemic differences.
- Dynamic Charts –
- A stacked bar graph breaks down Initial, Renewal, and Replacement receipts so users can gauge volume composition at a glance.
- A donut chart illustrates outcome shares (approved, denied, pending) with tooltips that show both counts and percentages.
- A view toggle flips charts between absolute numbers and percentage mode, aiding quick comparison across categories of different sizes.
- Expandable Data Table – Power users can drill into every numeric field—receipts, approvals, denials, pendings—for each application type.
- Responsive & Accessible – Built with semantic HTML, aria-labels, and high-contrast colors to ensure usability on all devices and for assistive technologies.
Together these components let analysts, advocates, and policymakers answer questions such as:
- Which categories drive the largest pending queues?
- How do renewal approval rates differ from initial ones in student versus humanitarian programs?
- Where might targeted staffing increases yield the biggest backlog reductions?
Conclusion
The FY 2025 Q2 snapshot of Form I-765 activity reveals record-setting demand driven chiefly by asylum applicants and long-standing humanitarian programs. While approval productivity remained strong, the sheer influx—particularly in “A” humanitarian categories—continues to swell the pending inventory.
The accompanying dashboard empowers stakeholders to interrogate every metric in real time, bridging the gap between raw spreadsheets and actionable insight. Going forward, sustained throughput combined with backlog-focused strategies will be essential to keep pace with applicants’ need for timely work authorization.


